Insight Reports are the primary reporting tool in FetchEH. Reports are built using a Filter that produces matching results for the Report. Results can be exported, printed and can include Field Statistics to further understand Results.
Reports can be setup for operational workflows, MPR reporting or designed to better understand a specific aspect of a workflow or data.
Creating a Report #
This section will walk through the steps used to create a new Report.
1. Use the Main Menu to select the Insights button.

2. Select the Report option from the Insights menu to create a new Report.
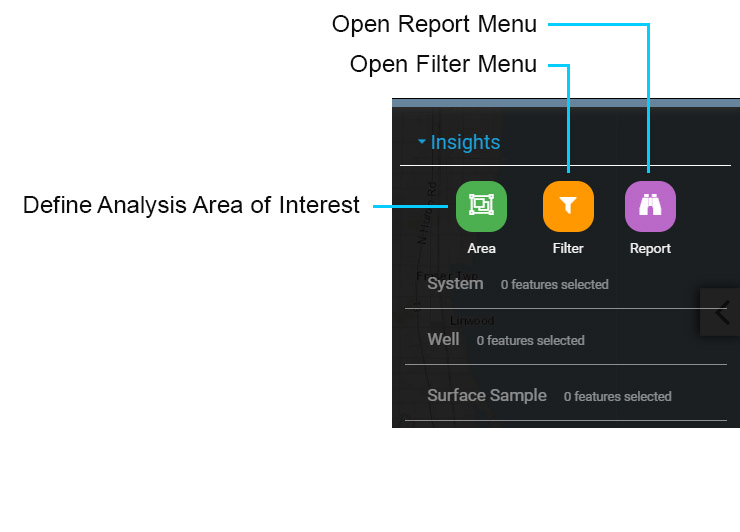
The Report menu is used to manage Reports, including building Reports, saving Reports, copying Reports, deleting Reports and executing Reports. The Report menu is described below:
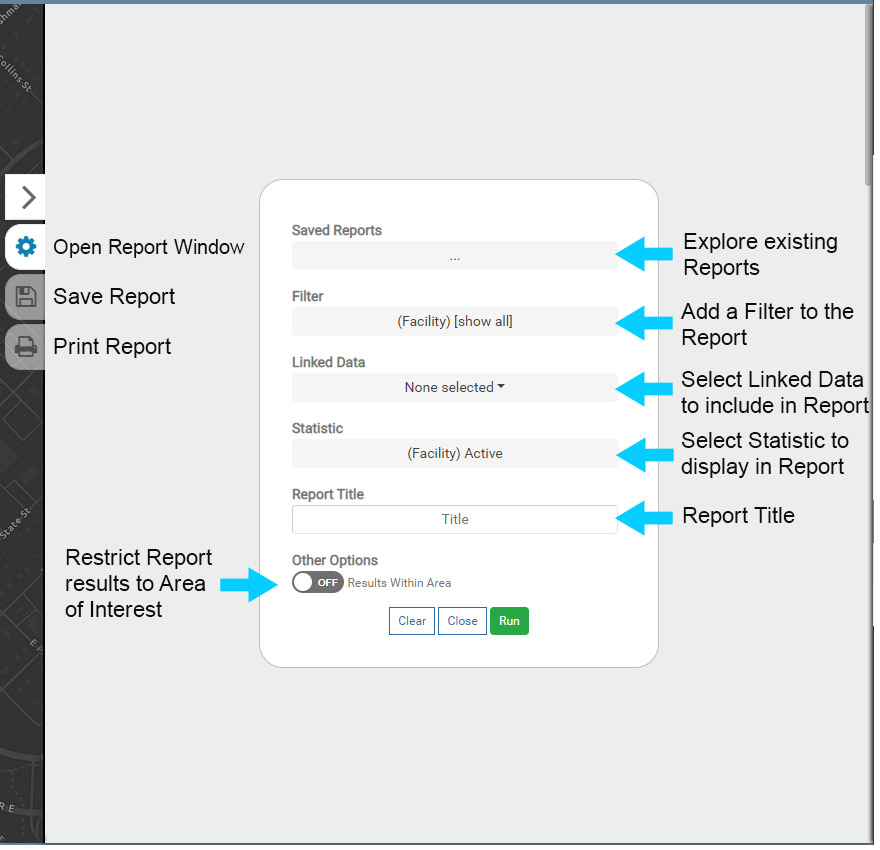
Report Menu
Saved Reports: select the grey box to view existing Reports. Select a Report to load it into the Report Menu.
Filter: open the Filter menu to select an existing Filter, or create a new Filter. The default setting is to show all data.
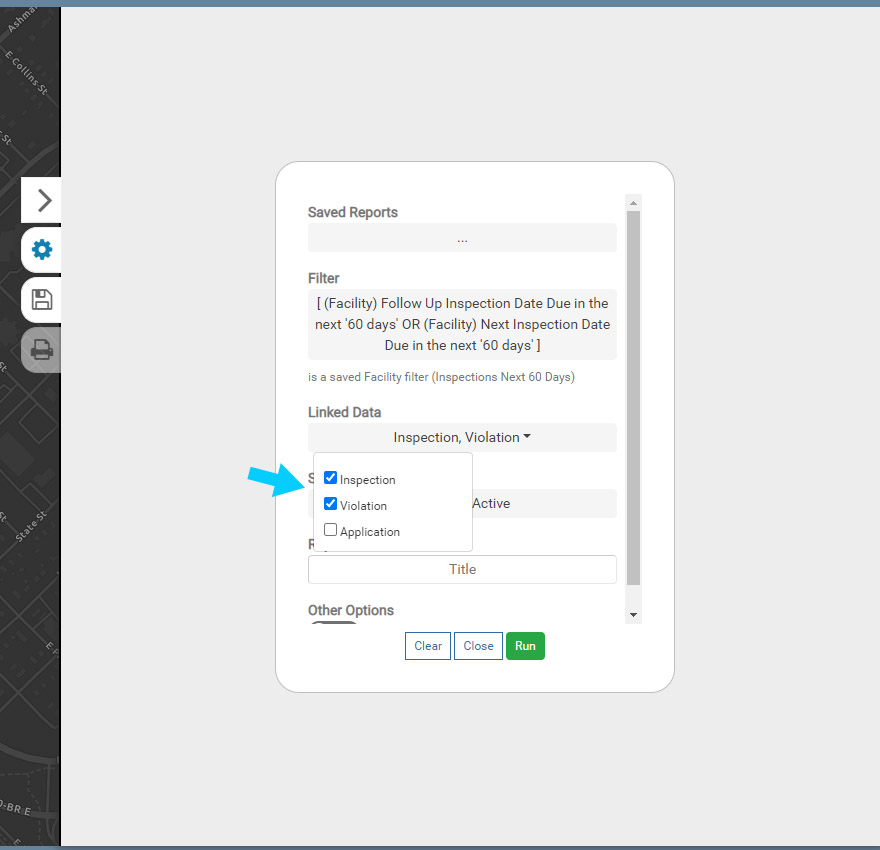
Linked Data: select the Linked Data tables to be include in the Report. By default, the System, Well or Facility tables and corresponding fields are included in a Report. Toggle on additional tables to include, such as the Septic Tank, Drainfield, Inspections, Violations, etc.
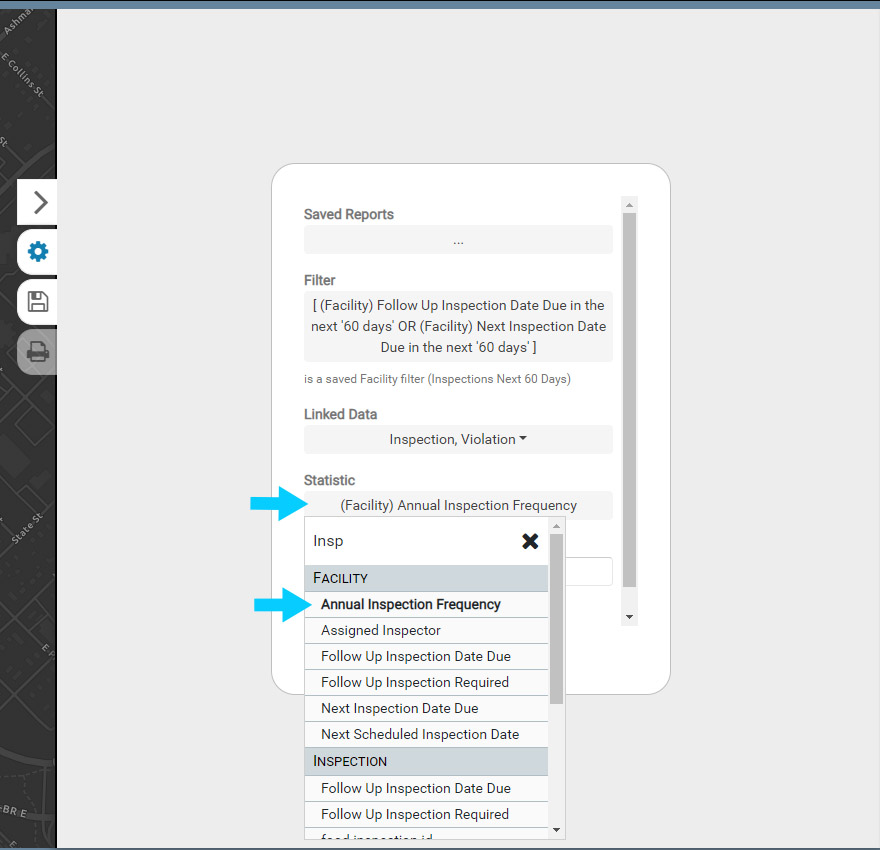
Statistic: select a summary Statistic to be used to display charting at the top of the Report. For example, selecting the field Inspection Purpose will create a bar chart with each Inspection Purpose and its corresponding count.
Report Title: enter a Report Title for a new Report. When opening an existing Report the Title, if present, will be displayed here.
Other Options: if an Area of Interest is currently displayed on the map, toggling this option on will restrict the Report results to the Area of Interest. This can be useful for creating Reports in multi-county agencies, for specific watersheds, townships and more.
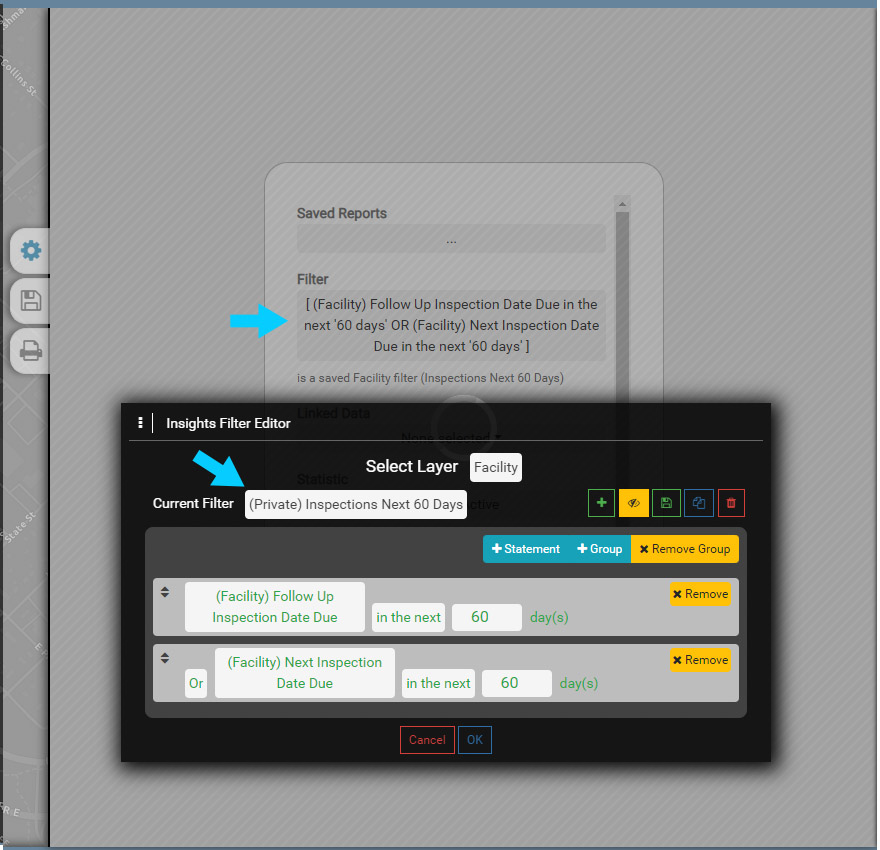
3. Select the grey box under Filter to open the Filter menu. Select an existing Filter or create a new Filter to add to the Report.
Select OK to add the Filter to the Report.
4. Under Linked Data, select the tables that will be included in the Report. Selecting a table, such as the Inspection, will add all of the Inspection Fields to the Report.
Reports may only require one table, so there may not always be a need to add all tables to your Reports. For example, if your Report is looking for all Inspections in Q4, you may only be interested in the Inspection table as that table will contain Inspection Purpose and Inspection Date. However, if you also want to understand the Violations that were cited during Q4 Inspections, you would also include the Violations table in your Report.
5. Select a Statistic to summarize in the Report.
6. Enter a Title for your Report and then select Save to save it.
Note that if a Report is created for a one-time use, it does not have to be saved. Saving a Report will make it available for recurring use.
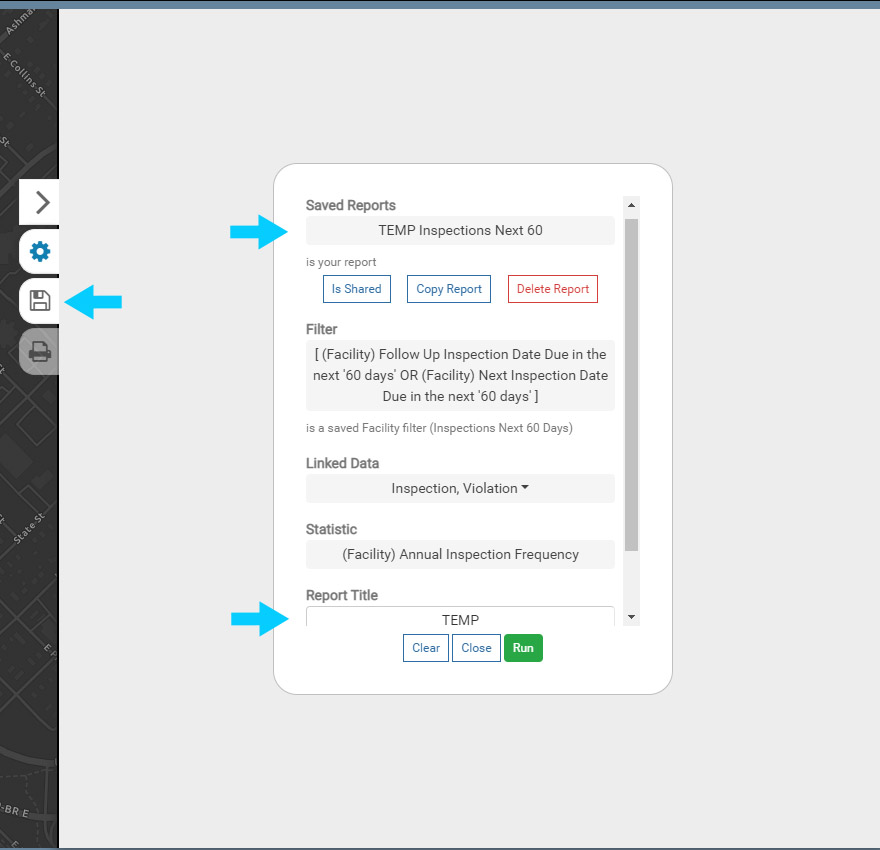
7. Select Run to execute the Report.
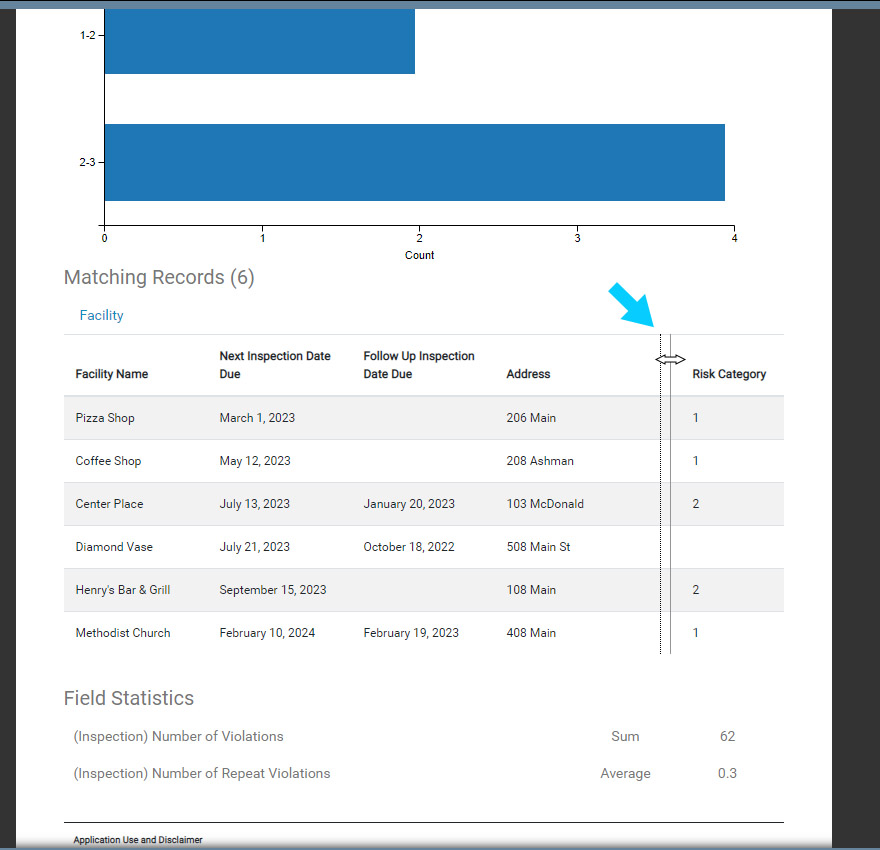
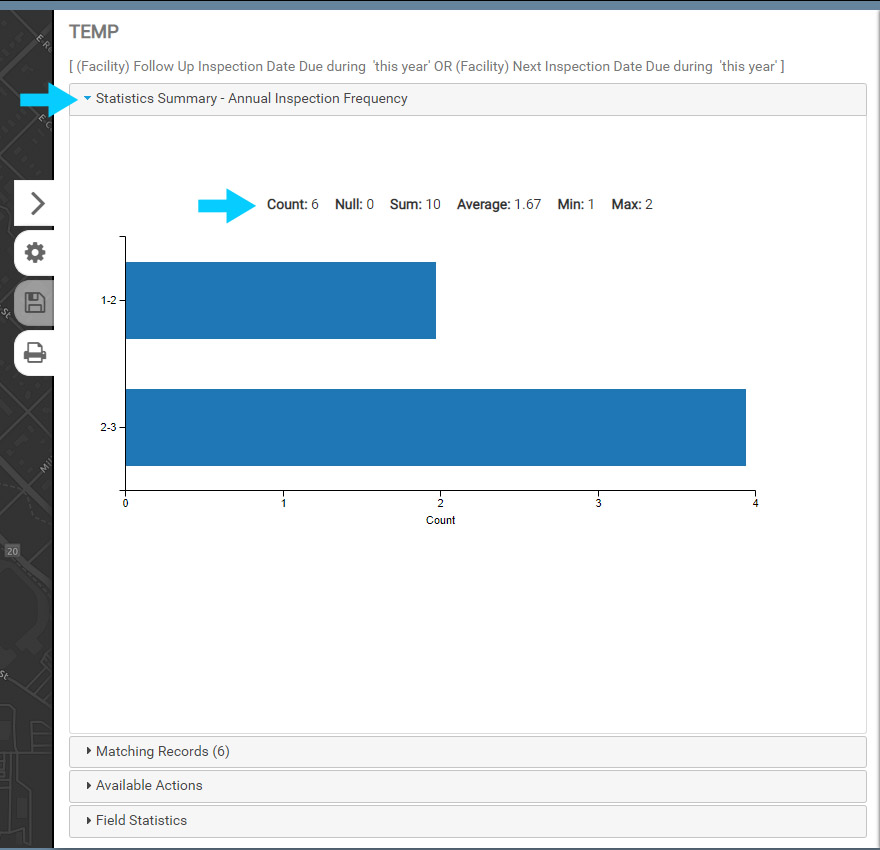
The Report will display the Report Title and the Filter used to created the Report at the top, followed by accordions that manage different aspects of the Report.
There are 4 accordions, which are described below:
8. Open the Statistics Summary accordion if it is not open by default. The Statistics Summary provides an overview of the Matching Results, including summary statistics and a chart. The chart is derived from the Statistic field selected when creating a Report.
Note that you can return to the Report menu by selecting the gear button (Report Options).
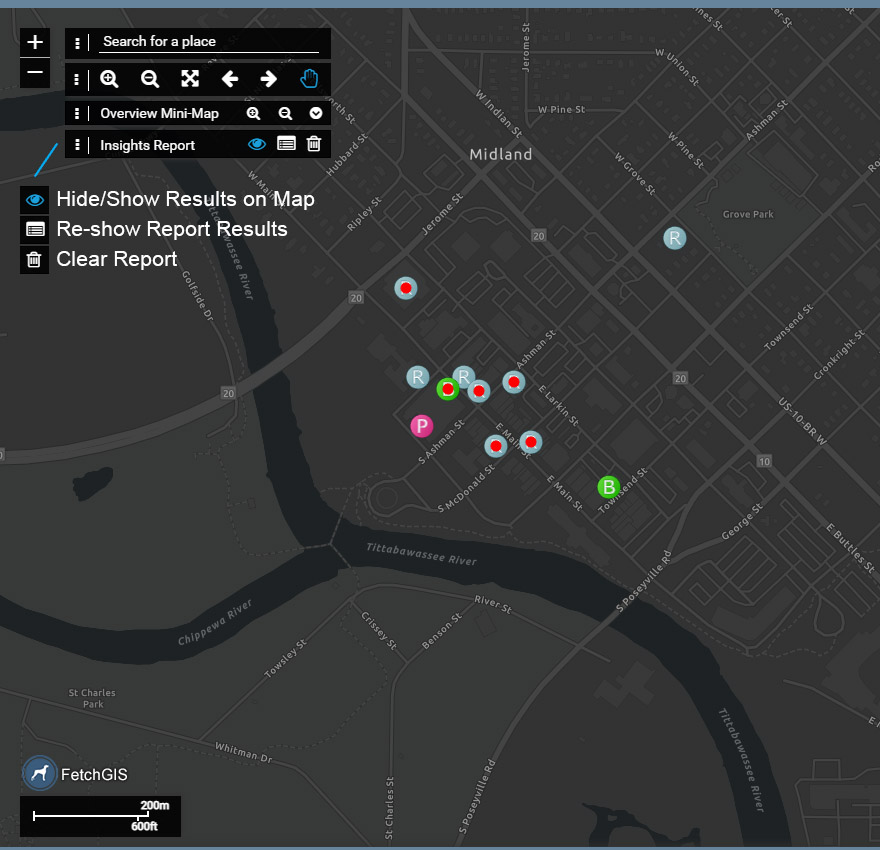
The Matching Results of a Report are also displayed on the map. The Insights Report toolbar also provides the following options:
Hide/Show Results on Map: toggle on/off the visibility of the Matching Results on the map.
Re-show Report: opens the Report Results window. This option is useful when selecting Matching Records in a Report, which zooms to the location of the selected Record on the map and opens the corresponding Form (Food Establishment Form), and you need to jump back to the Report Results.
Clear Insights Report: clears the current Report.
10. Select the Matching Records accordion to open it.
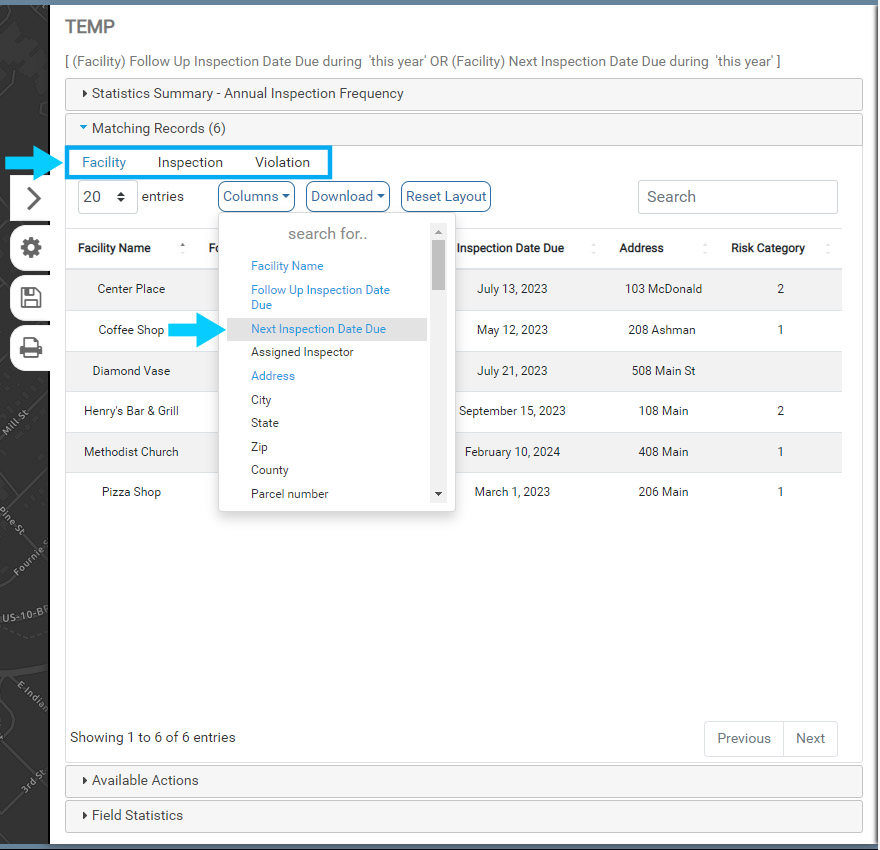
The Linked Data tables and the parent table are all listed at the top of the accordion (Facility Inspection Violation). Select each table to note how the corresponding records and fields are loaded into the results window.
Use the Columns menu to hide/show different Columns. If you make changes to the layout, be sure to Save the Report again to retain the layout changes – this will remove the need to re-create the Column layout each time you run the Report.
Columns: select what columns (fields) are visible or not visible in the results window. Note that you can add parent fields to Linked Data Columns. In the Columns for Inspection for example, scroll down until you see the parent fields, which are prefixed with (Facility) to note that they are not an Inspection field.
Download: download the results to a CSV file. Select Visible Columns to only export the visible Columns, or select All Columns to download all Columns in the corresponding data.
Reset Layout: returns the Column layout to the default setting.
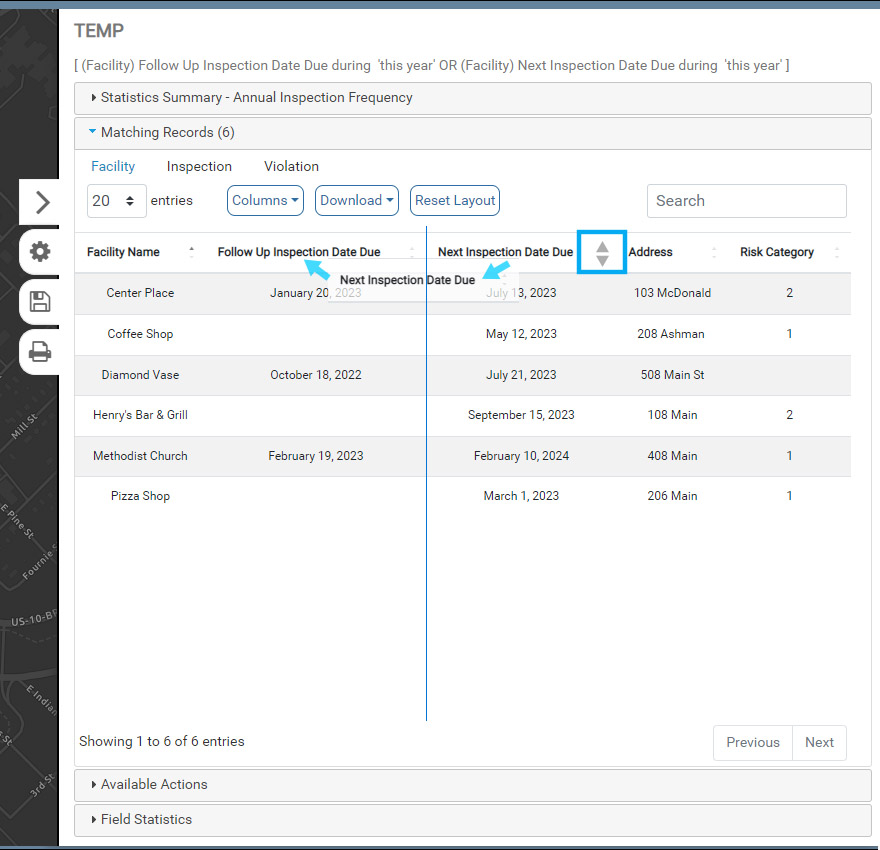
11. Move a Column by holding down the mouse key over the Column name and then drag it to a new position.
Each Column can also be sorted using the grey arrows to the right of the Column name.
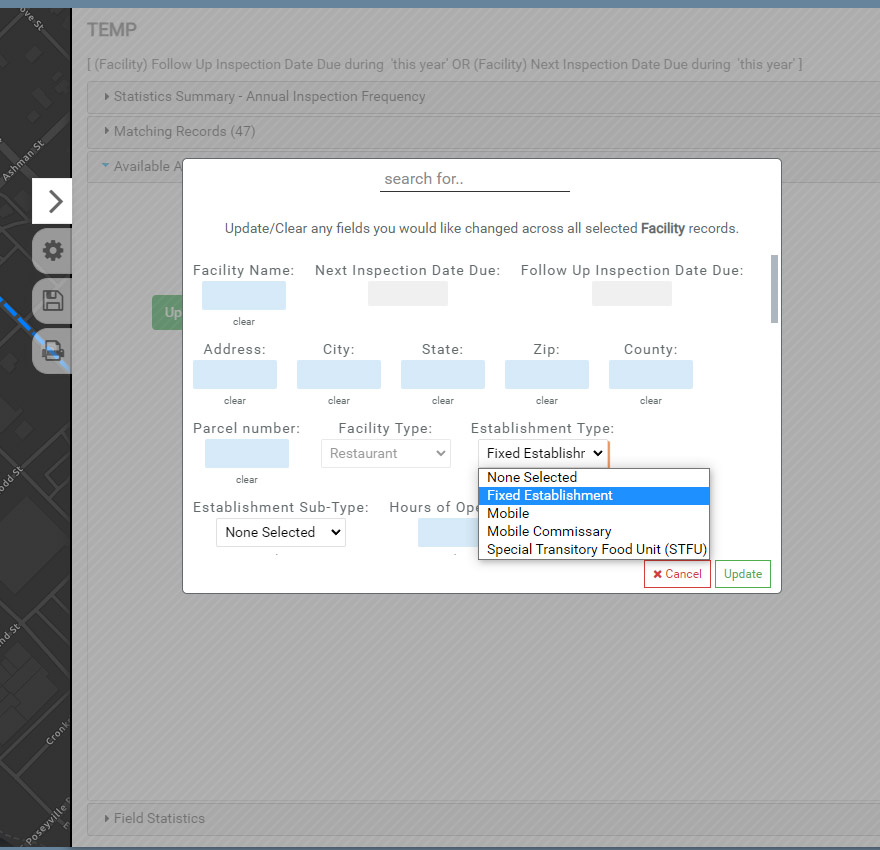
12. The Available Actions accordion is used to perform Bulk Edits. Bulk Edits involve updating one or more Fields and corresponding values for the Matching Records.
In the example below, the Establishment Type for all Matching Records will be updated to Fixed Establishment.
Another example may include changing the Risk Category for multiple Restaurants or the Expiration Date for multiple Operations Permits.
Note that the Bulk Editor will overwrite any existing values in the select Field for all Matching Records.
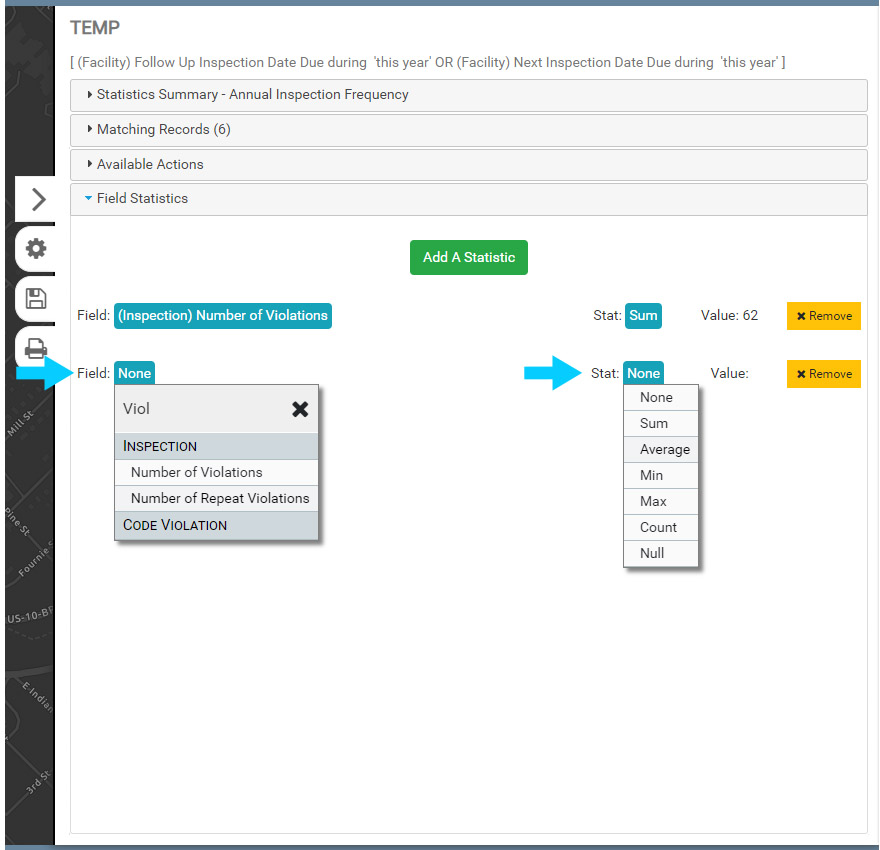
13. Select the Fields Statistics accordion to open it.
Select a Field to generate statistics from and a Stat. Once both are selected, a Value will be displayed.
Similar to the Column layout, Field Statistics are saved with the Report, so be sure to Save your Report if you add Field Statistics that you would like to use again in the same format.
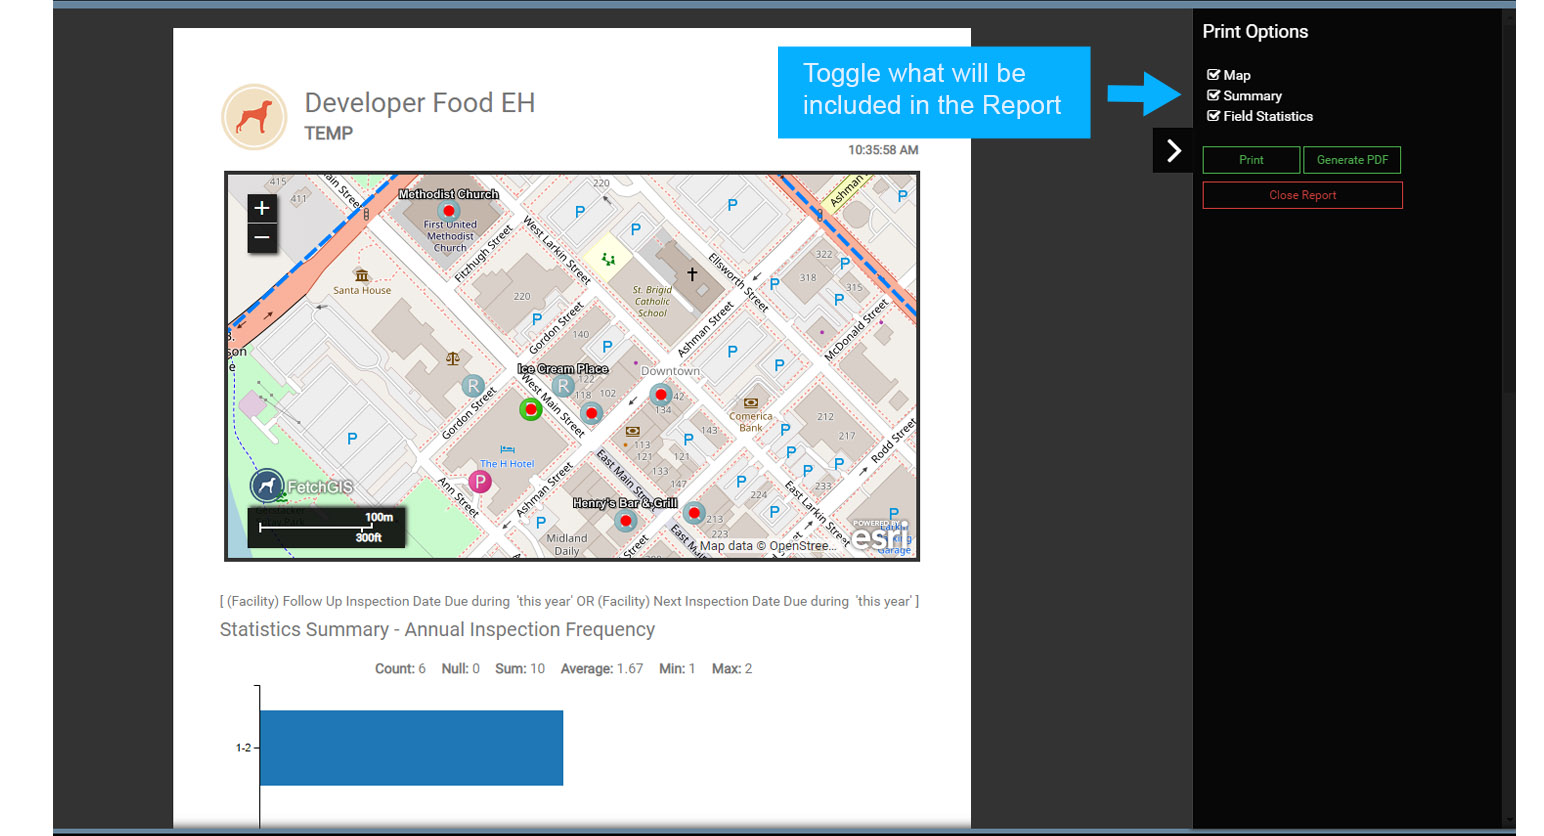
14. Select Print on the Report menu to generate output.
Use the Print Options to control what elements are displayed on the Report and to format the output.
15. Fine tune the layout of the Report by modifying the Column size. Hold the mouse key down over a Column border and drag it to modify the siCRe